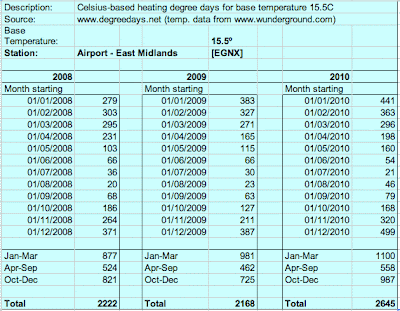
Degree Days are a good way to assess the thermal performance of the month and the year as they record the number of degrees during how many days that heating systems were required to bring the building up to a desired temperature.
We normally use 15.5º in degree day calculations on the basis that incidental gains are enough to make the temperature comfortable. This is a bit approximate, as in the recent winter, there has been little sun through windows, and with energy efficient lighting, appliances and cooking, the incidental gains are less than hoped for. Incidental gains in equinox times are perfect, but in December and January? Not much!
The figures above show the degree days on a month by month basis for Nottingham, for the last three years. 2008 was a very typical year, whereas 2009 was somewhat milder. The year of 2010 was truly more severe by 20%, with the very cold spring and the very cold winter occurring within the same calendar year.
I have split the year into 3 blocks which equate to the times I use for metering, Jan-Mar, Apr-Sep and Oct-Dec. As these figures are monthly, I can relate these to the consumption of the heating system, and generate a sort of index of performance.
The figures above show the degree days on a month by month basis for Nottingham, for the last three years. 2008 was a very typical year, whereas 2009 was somewhat milder. The year of 2010 was truly more severe by 20%, with the very cold spring and the very cold winter occurring within the same calendar year.

What does this mean graphically?
Well, it shows that there has been a cooling winter trend annually. Do not be deceived into thinking that this disproves 'global warming' because climate change globally is about change, AKA chaos. It does not result in every place getting warmer. Britain could get cooler if the Gulf Stream is affected by melting polar ice.
If you want more explanation about Degree Days, you are welcome to email DNC
Post script: The first day in 2010 that had evening temperature higher than 10.0º was 17 March! We have having a succession of days like that in mid January 2011.

No comments:
Post a Comment